
3D Project View

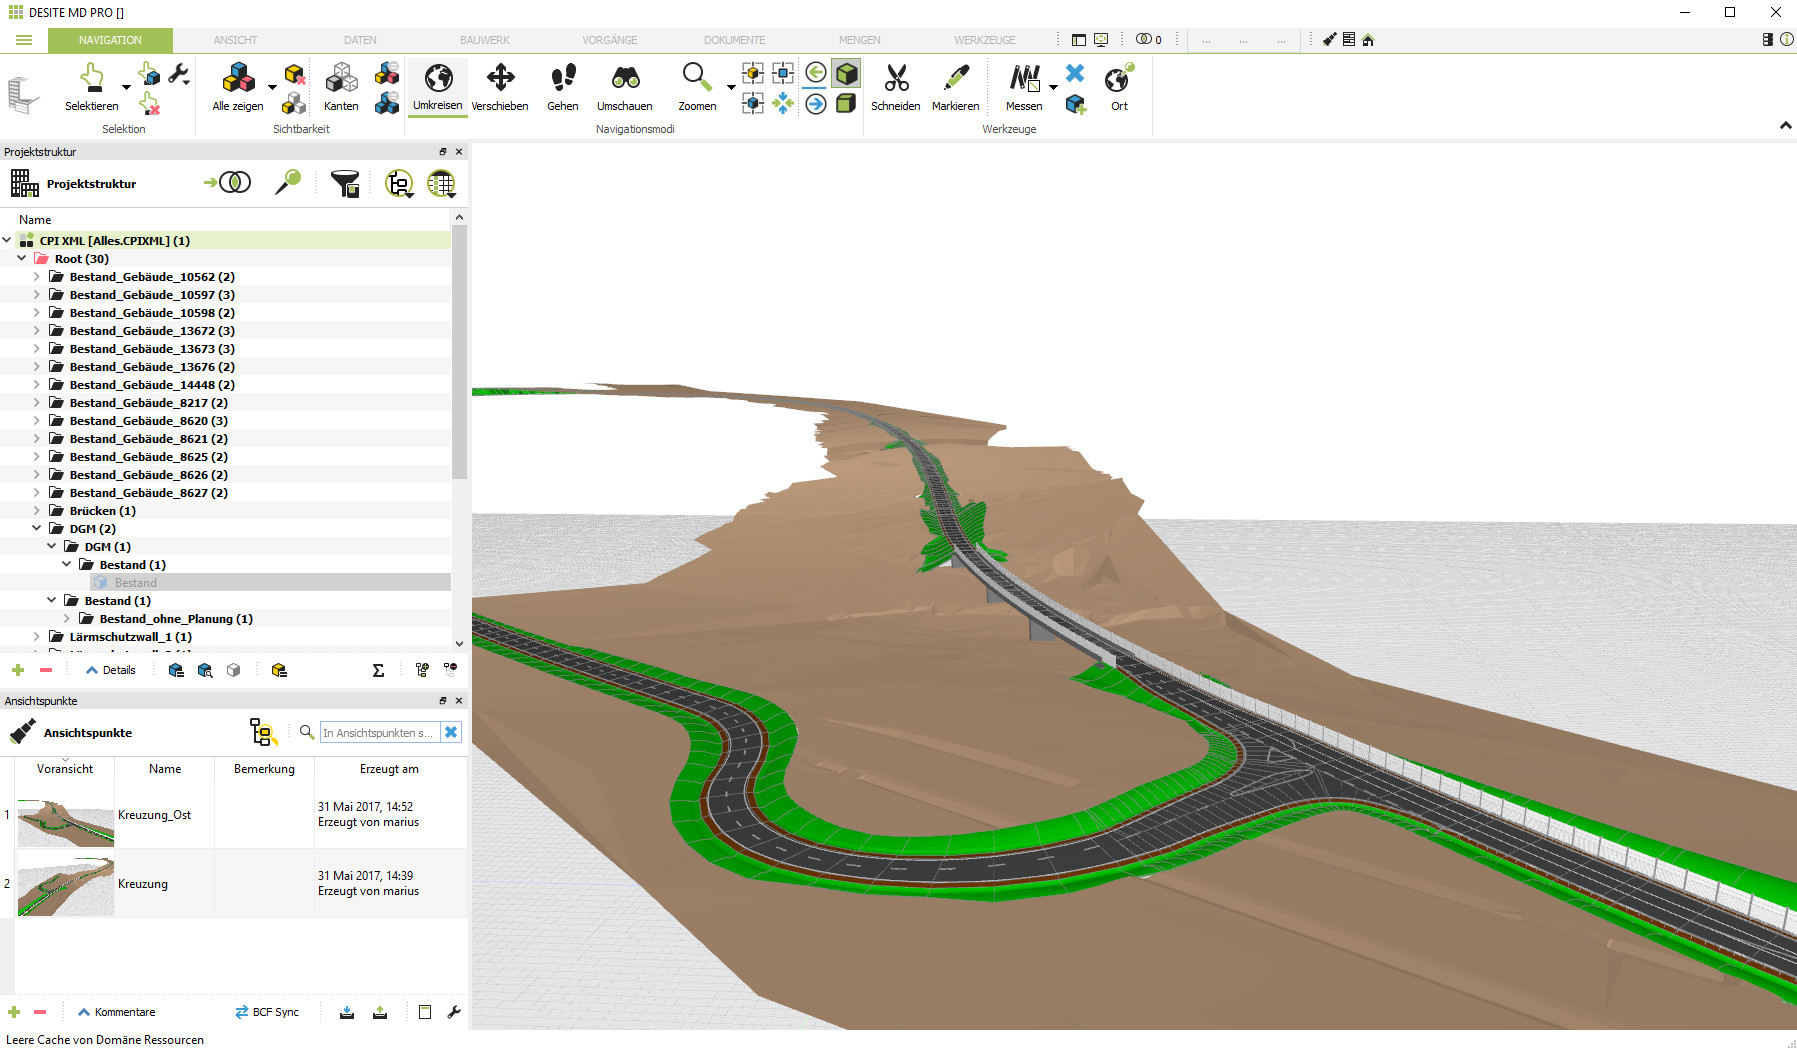
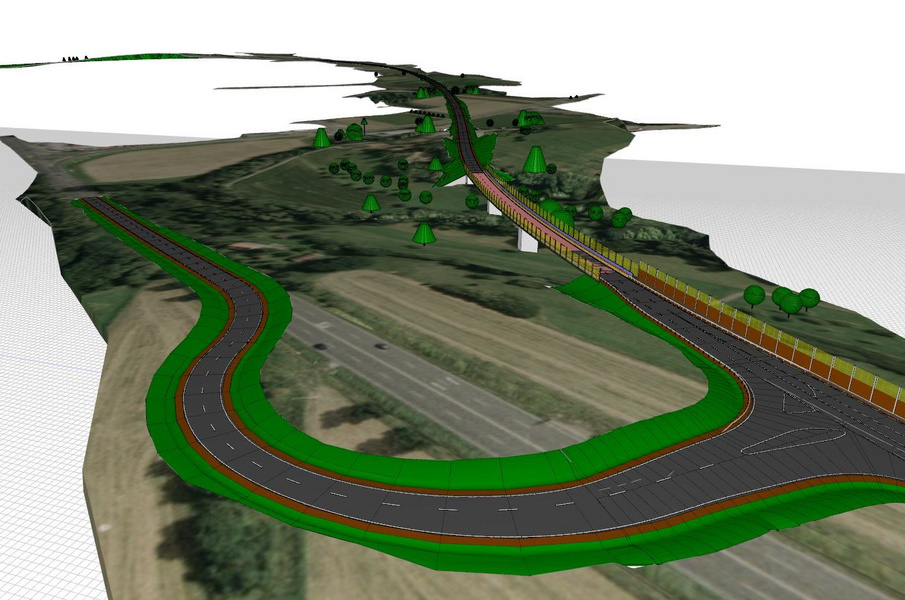
The 3D Project View enables you to analyse your project data in 3D and helps you to locate possible glitches or errors in your design at a very early stage.
The software has been highly optimized in order to process even large quantities of data quickly and conveniently. E.g. complex digital terrain models and point clouds which as a 3D image can display any detail from any angle, thus ideally complementing the information on the existing conditions.
This module supports the BIM planning process.
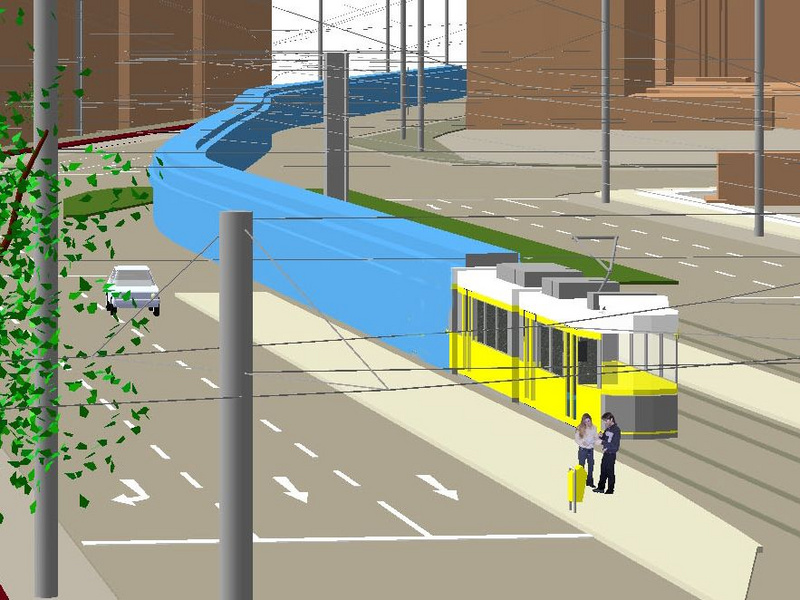
4D Sewer Level Simulation
Visualize the time-based simulation of the sewer flow; qualitative as well as quantitative evaluation and representation of the water level of a dynamic sewer network calculation with comparison of variants. Requires the 3D Project View module.
Alignment Evaluation
You can use this module to analyse and evaluate calculated and saved alignments using various methods.
The results are displayed immediately and also printed if desired. Any calculated coordinates can be saved to the card_1 point database.
Alignment Design
You can design road alignments for built-up and rural roads on-screen together with roundabouts and at-grade (single level) junctions taking the applicable design guidelines into account.
Scanned maps, orthophotos, digital data, check surveys and DTMs are the data basis for the alignment design. Especially when planning roads, the advantages of the card_1 system's properties make themselves apparent.
Alignment Design (Rail)
")
You can design track alignments with rail-specific transition curves, switches and cants on-screen. card_1 supports any existing transition curves and cant gradients. You can design with card_1 anywhere in the world. You need clothoids, Bloss curves and Schramm parabolae in Germany, cosinusoidal curves in Japan, sinusoidal curves to design Maglevs and the curve type Wiener Bogen® to design for the Austrian Federal Railways. Even rarely used radioids, which in certain regions are used to design tram lines, are available.
This module offers excellent features to design private or federal railway routes, including the route design elements required. The guidelines of the German Federal Railways and those of the Austrian Federal Railways are integrated in the system as well as the entire switch library. Switches are automatically calculated, whether they are located in straight sections, in curves or clothoids.
Alignment Management

Alignment Management offers functions to copy, delete, rename and transform alignments. The alignments are managed together with their properties and design guidelines.
When exchanging data with third party systems, the alignment master points can be imported and exported using the applicable card types.
Alignment Drawing / Alignment Drawing (Rail)

You can create complete and technically sound alignment drawings with flexible annotations, carriageway edges and gradient changes. The batch mode enables you to generate multiple drawings in one step.
Alignment drawings may be displayed as a background layer in all base maporiented applications.
ALKIS Import
Import and revise the official geobasis data: land survey register and real estate register (ALKIS®), topographic data (ATKIS®) and fixed points (AFIS®) according to the AdV's AAA model. Preview on-screen. Updates with revised data.
ASCIBAHN Import/Export
Import and export of alignments, switches, cants, cross-falls and vertical alignments. Available formats: ASCIIBAHN 3.0 (Maglev), VERM.ESN (binary), GND-EDIT.
Automatic Alignment
You can automatically generate alignments from existing points from the card_1 point database. You only require a sorted set of points to generate alignments automatically.
The points can originate from check surveys or may be digitized on-screen using orthophotos or scanned maps. Previously existing and calculated alignments can be reproduced easily and quickly.
Platform Generator
Calculate the platform edge. Create the 3D objects for the platform. BIM-compatible attribution. Export for Autodesk© Revit. Calculate the setting-out points. Requires the Cross-section Editing module.
Modelling Existing Conditions
Generating 3D objects of the existing conditions incl. user defined or code based attribute assignment.
Image Documentation
Photo and video documentation for projects. Importing and managing geo-referenced images. Automatic transformation and positioning of images containing coordinates. Display and editing of images in the base map.
Bluebeam Revu Basics
Simple tools for creating, marking up and organizing AECO office and project documents.
Bluebeam Revu Core
Comprehensive tools for measuring, collaborating, and managing small to mid-sized AECO projects.
Bluebeam Revu Complete
Everything you need to accelerate and optimize complex AECO projects at scale.
Bridge Generator
Generate bridges as structures as part of the route development. BIM-standard structure of the assemblies. Use for drawings, sight distance calculation, structure catalog and BIM export. Standard bridge schematics included.
CardScript
Develop and execute scripts with the integrated card_1 programming language CardScript. Automate processes. Easy data handling: generating, altering, evaluating and analyzing project data. Results exported in files, graphics and reports. Data exchange via CSV, XML, Excel and SQL. Documentation and example scripts come with the software.
CityGML Import
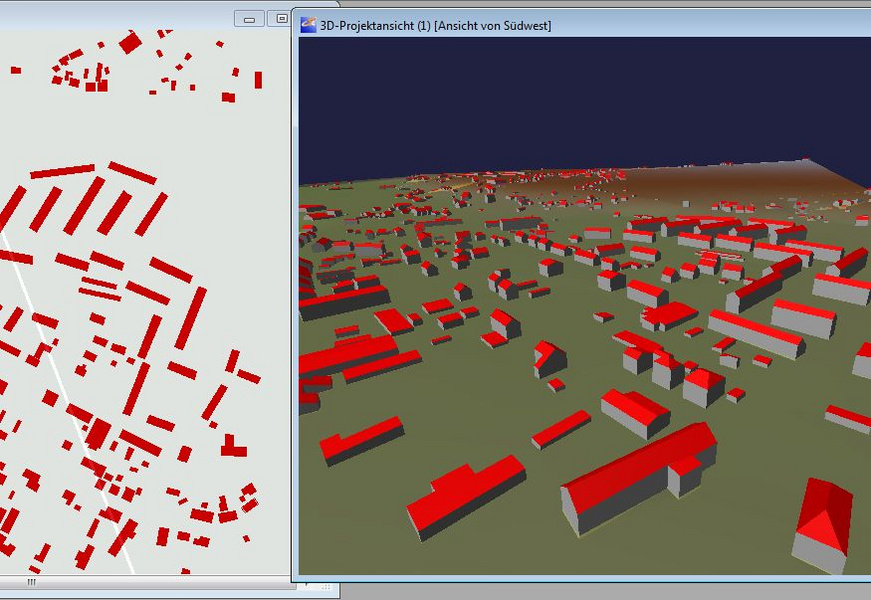
Import 3D-building data (3D-city models). Visualize in card_1 in e.g. the 3D-project view. Transformation into project coordinates-system 'on the fly'(requires the Transformation module).
CPIXML Import/Export
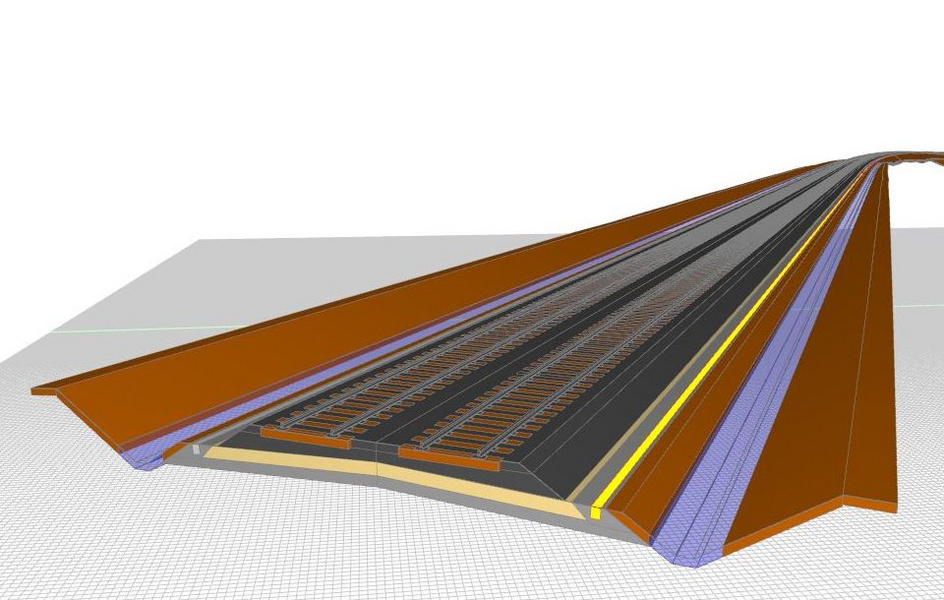
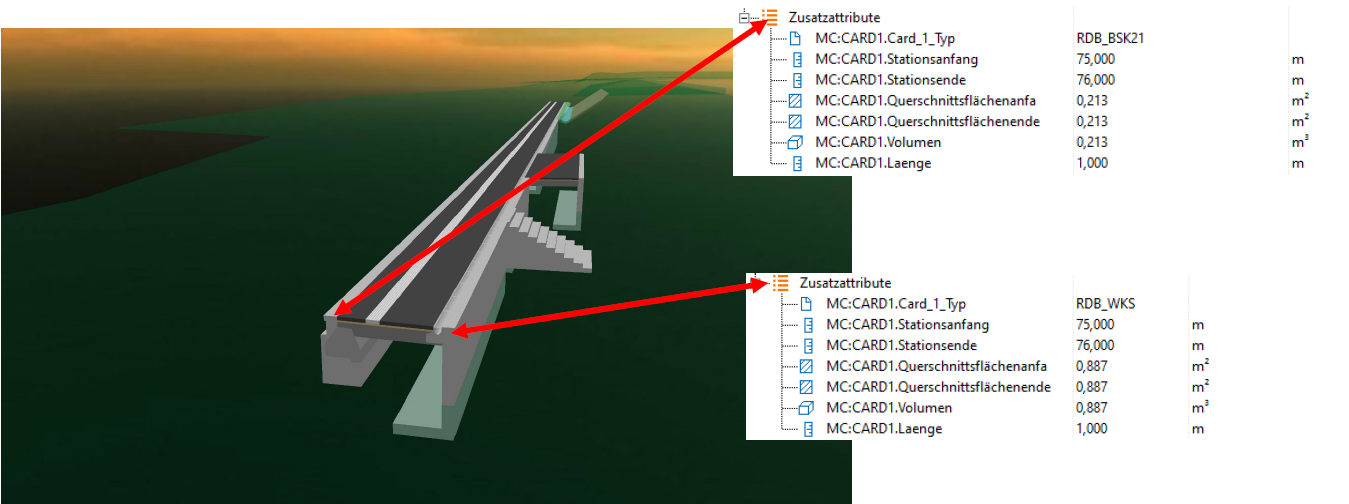
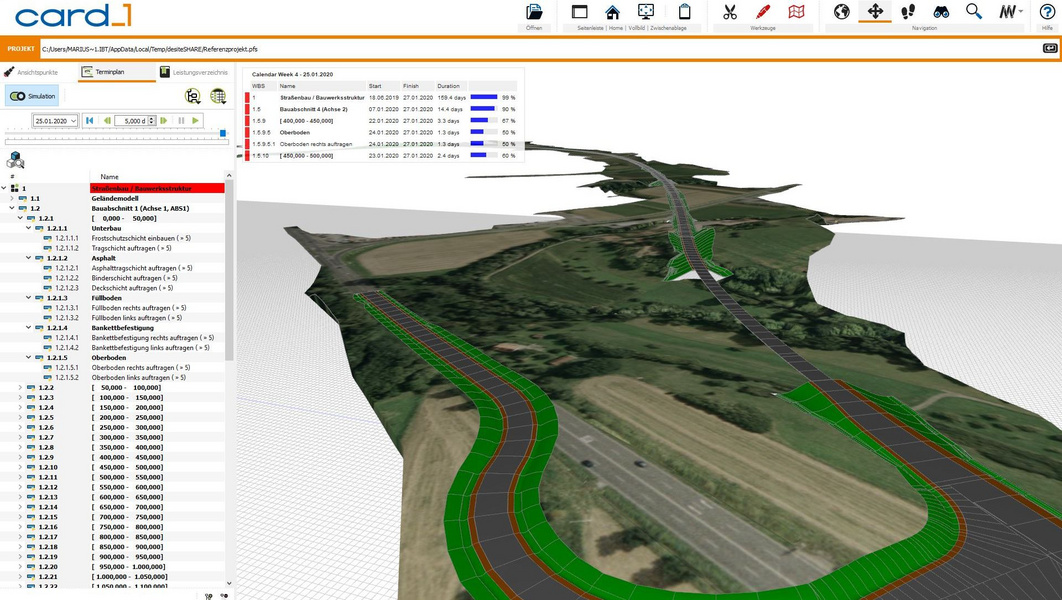
Generates BIM-route structures from cross-sections and 3D surfaces from DTMs; import/export project data incl. structures (volumes) and quantity positions from REB-methods in the CPIXML format (data exchange RIB iTWO, ceapoint DESITE etc.). Model visualization and exchange via card_1 DESITE share.
Surface Optimization
This module enables you to optimize existing road surfaces and makes reconstructing existing traffic routes very easy.
The main field of application for this module is to calculate vertical alignments and to analyze vertical alignments for 'overlay' resurfacing of roads of any category. Based on a new genetic algorithm, the program automatically picks the optimum vertical alignment from a range of variations.
DESITE BIM md
Interactive visualization, model analysis, 4D-simulation, documentation and notes, model extension and application programming.
DESITE BIM md pro
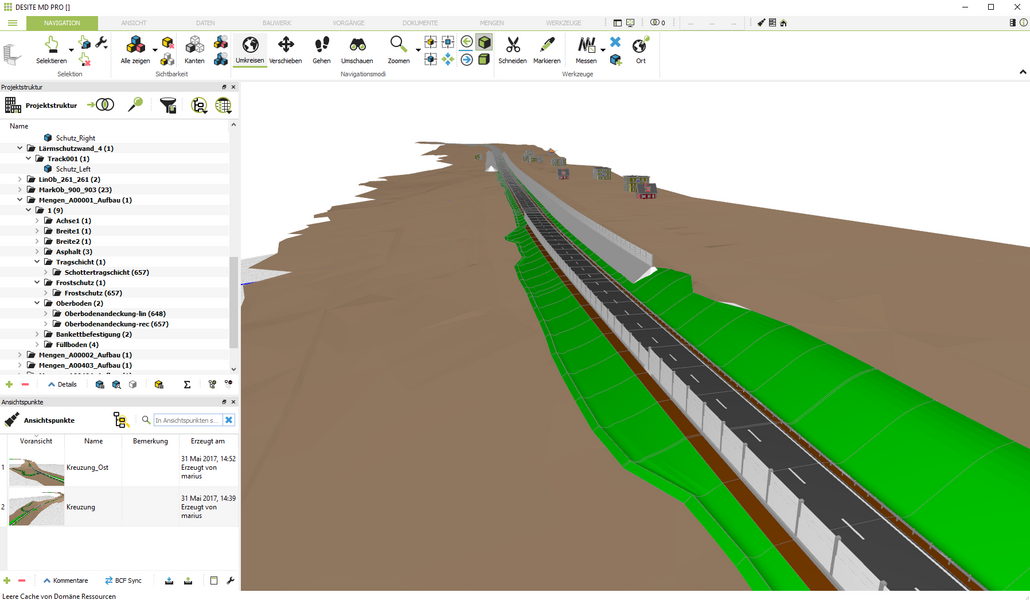
Interactive visualization, model analysis, 4D-simulation, documentation and notes, model extension and application programming, coordination of building sub-sections/checks on collisions, model checks/quality management, link to central database.
DESITE BIM custom
DESITE BIM custom is a simplified variation of DESITE. The project structure and the selection quantities are available. The 4D simulation can be run and the 'forms' module is included.
card_1 DESITE share
Interactive visualization and exchange of models for BIM-communication. IFC file viewer.
DTM Volumes
This module enables you to calculate the volumes in relation to a user-definable horizon or the volumes between two digital models with an identical hull according to the German guidelines REB-VB 22.013. This method is especially suitable for calculating the volumes of extraction sites, quarries, gravel pits, landfills, dams, reservoirs and for designing traffic routes.
You can chose this method when dealing with digital terrain models which either have identical hulls or share the same plan area.
DTM Intersection
This module enables you to calculate the volumes between two digital terrain models by intersecting them according to the German guidelines GAEB-VB 22.114. This method is especially suitable for purely cut and fill projects, e.g. foundation ditches, dams, landfills, but also for cut and fill projects such as airfield constructions, industrial areas and landscaping.
You can chose this method when dealing with digital terrain models which have neither identical hulls nor do they share the same plan area.
Digital Terrain Model
You can create and edit digital terrain models with this module. DTMs are the basis for volume calculations and surface-related studies, e.g. road drainage systems for intersection points. You can also derive longitudinal profiles, cross-sections and contour lines from digital terrain models.
Digital terrain models are one of the many data bases for the 3D Project View in card_1.
DWG Import
Import of data in DWG (AutoCAD) format as drawings or plan view data. Requires module DXF Import.
eView

eView is especially ideal for presentations, either internal or to the public, e.g. for a discussion round: you can communicate all the details relating to the technical planning both clearly and illustratively.
eView is also good value when it comes to providing your employees with digital versions of maps and plans which would otherwise hang as paper originals in a map cupboard. The results are page-oriented and are unalterable copies of the original. Any formatting, text fonts, graphics or photos are reproduced true to the original.
You'll find that you can significantly cut duplication costs, files and mounds of paper.
eView is available in the following modules: eView S, eView M, eView L as well as eView key for user administration.
Vehicle Dynamics Check
Check the track geometry according to the applicable guidelines, examine the speeds.
Route Simulation
Animated test-drive of roads and railway tracks plus fly-overs in the 3D project model. To test project data visually or for presentations. Visualize the sight distances according to RAL, HViSt and others.
This Module supports the BIM-planing process.
Watercourses
Design, edit, run hydraulic calculations (HEC-RAS) and evaluate watercourses (open channels).
GEOPAC-Clearance Envelope for card_1
Calculate clearance envelopes for LRVs. The 3D clearance envelope is created as a card_1 structure and used for clearance space analyses. A comprehensive vehicle library with an integrated vehicle editor comes with the software.
GIS Import
The Import Shape Data interface is an easy to use tool to import GIS data and WFS data into card_1.
Design objects are also based on the data of the existing conditions. These are managed in geographical information systems. Nature reserves, conservation areas, water conservation areas, flood areas, administrative borders as well as road and other data are examples of data compiled in such systems.
Products from the ESRI(r) ArcGIS family are so common that the Shape format has basically established itself as the standard data exchange format. Some of the German federal states' environmental authorities even provide free access to Shape data on the internet.
You can seamlessly import any geometric and attribute data into your card_1 project using the new Import Shape Data card_1 module. The interface enables you to import points, polygons and areas as well as any object attributes making it very easy to include this geographical information while designing and creating drawings with card_1. You can access the attributes to run analyses and other evaluations within card_1.
Vertical Alignment Design / Vertical Alignment Design (Rail)
Designing and editing vertical alignments is similar to designing alignments, in that you can conveniently design and edit them on-screen taking constraining points into account. The relevant design data is displayed and synchronized in the various views, e.g. longitudinal profile, curvature string and cross-fall string.
In the card_1 system, vertical alignments are height profiles defined using tangent intersection points. They are used not only to describe the vertical profile of roads, railways and sewers, but also as height definitions for swales, ditches, carriageway edges and other alignment-related structures. Individual evaluations or evaluations as lists are integrated in the application.
Vertical Alignment Builder (Rail)
")
You can generate an optimized vertical alignment (as close as possible to the existing ground profile). When using this module, the program automatically picks the optimum vertical alignment from a large number of variations. Besides the on-screen check the program provides you with a comprehensive report of all input data. You are notified whenever the defined value limits have been exceeded or fall short.
One main field of application is to upgrade and optimize existing track facilities. As the route parameters are not available for all existing routes, this module supports those working on a project by automatically reproducing both the planimetric position and the height of the route from surveyed track facilities.
Vertical Alignment Transformation
You can use this module to calculate dependent vertical alignments for ramp alignments, or transform vertical alignments onto other more or less parallel alignments.
Graphic Fieldbook
Control and import of observation data from total stations, processing of observations and capture of object information, setting-out. Capable of user control in the field.
Land Acquisition Logging
If it's your task to log and manage land acquisition data, this module's graphic user interface is ideal for showing project status while also ensuring that the data is up to date. As the land acquisition data is fully integrated into your project, you can produce land acquisition directories and land acquisition plans in compliance with RE (German design guidelines) from the one source. And the benefits? It enables you to prevent redundancies, avoid errors and to work within one project data environment. Later corrections therefore become only a fraction of the work otherwise involved.
The data can be logged or imported via an interface and then passed on to your client using the integrated OKSTRA interface. The OKSTRA format allows you to exchange the necessary data regardless which software tools are used. Any database may be used to export the data, e.g. Microsoft ACCESS.
Land Acquisition Intersection
Convenient land acquisition processing. Automatic determination of sub areas. Produce sketch-maps.
Hybrid Drawing Editing
You can jointly output raster data and vector data into one drawing with this module, i.e. you can mix raster data and vector data in one drawing.
This is a very easy way to upgrade your drawings by simply adding your clients’ logo or trademarks. Or you can incorporate photos for project documentation purposes or overview maps.
HYSTEM-EXTRAN Import/Export
Two-way interface to the Hystem-Extran calculation program of ITWH Hanover. Requires the Sewer Cadastre or Sewer Design module.
IFC Import/Export
Generating BIM route structures from cross-sections and 3D surfaces from DTMs; Importing/exporting IFC objects to exchange 3D project data incl. engineering structures (spatial structures) and quantity records from REB methods in BIM projects. The basis is IFC version 4.0 or 4.1. Model visualization and transfer via card_1 DESITE share.
Sewer Data Logging
Log sewer networks for urban wastewater management as a seperation or combined system from a measurement or digitised data. Design, exchange data (ISYBAU), manage master data incl. connections to housing, gullies or special structures.
Sewer Data Import/Export
Import of sewer data from ISYBAU Format Typ K/EY and Im-/Export of sewer data in ISYBAU Format XML.
Sewer Cadastre
Set up (ISYBAU data exchange), manage (master data, existing conditions data, property holdings optional), calculate (evaluation of existing conditions, sewer rehabilitation optional), document (base map, profile drawings, damage report, manhole condition), analyze and evaluate sewer networks.
Sewer Network Hydraulics - Hydrodynamic

You can run a hydrodynamic verification calculation of sewer networks. This model is suitable for 1,000, 2,000, 3,000 and more than 3,000 reaches.
This complies with the European Norm EN 752 as well as with the ATV (German Association for the Water Environment) guideline A118 for larger networks or within areas with increased safety requests when using the hydrodynamic calculation method. They stipulate that flooded areas must be verified. Detailed knowledge about how a sewer network copes with submergence is provided by simultaneously calculating sewer cross-sections and special structures in one calculation step.
Sewer Network Hydraulics - Hydrological

You can calculate and dimension sewer networks according to a hydrological calculation model. This model is suitable for 1,000, 2,000, 3,000 and more than 3,000 reaches.
The hydrological calculation model considers the entire run-off curve and determines its change on the surface and in the sewer network. Thus the actual sewer conditions are taken into account when dimensioning and calculating storm water tanks.
Sewer Network Hydraulics Time Coefficient Method

You can calculate and dimension sewer networks according to the time coefficient method for a maximum of 250 reaches. This method is used to dimension and conduct preliminary planning of "simple" networks.
You then define the rainfall frequency and use either block rainfalls according to Reinhold or create your own rain definitions, e.g. following the so-called KOSTRA-Atlas (coordinated regionalized heavy rainfall evaluations). more >
Sewer Design
Design sewer networks for urban wastewater management as a separation or combined system. Design (in the base map and longitudinal profile), calculate (time coefficient, stationary, transient) calculate excavations, draw longitudinal profiles, sketch manholes, exchange data (ISYBAU), manage master data incl. connections to housing, gullies or special structures.
Sewer Rehabilitation
Create, calculate, manage and document rehabilitation measures for local wastewater management. Compare costs according to the LAWA guidelines.
AKVS/elKe Cost Calculation
Calculate costs according to AKVS based on the cost calculation catalogue (KBK) for route design, structure design and telematics design. Fees calculated according to the current German HOAI guidelines. Output in AKVS forms. Export according to KOSTRA. Quantities imported from card_1.
Cost Calculation Civil Engineering Pro
Create and manage individual catalogues based on the KBK system catalogues. Enter free items in the "number 9 range", up to 99 items per hierarchy level. Calculation of quantities ("smart calculation" feature). Precise output in euros.
Base Map
More than 300 functions are at hand when working on topographic data. You can use these functions to design on-screen, to edit and manage points, lines, texts, symbols and other data in the base map.
There are several available to generate engineering-standard slope hachures. Numerous evaluation functions, e.g. to generate annotations or to calculate areas, support you when pre-processing the project, when checking the project data or when creating the results reports.
When working on a project there is no need to define any map sheets, map scales or drawing guidelines. The size and position of the sheets as well as the relevant drawing guidelines are defined at the very end when producing the drawings. This avoids any redundancy in your work which would otherwise be inevitable in planning systems based on sheet-oriented data management.
Base Map from Cross-Sections
You can import the relevant cross-sectional information, e.g. points, lines and slopes into the base map.
Base Map Generator

You can use this module to create your base map data more easily by automatically creating this data from survey points. You can log the data of traffic routes, buildings, slopes, ditches, utilities or sewer networks and structure the data in layers.
The generator eliminates tedious and repetitive manual work and enables you to automatically run multiple editing steps in one go based on your settings. Thus significantly reducing the number of errors and the time normally spent on these tasks. It makes the project work much quicker and easier as well as more economical. more >
Sewer Base Map Drawing

You can create complete, ready-to-deliver, technically-sound sewer base map drawings in compliance with the existing guidelines with flexible annotations. This module is especially useful when logging the existing conditions, for reconstruction works or when planning sewer networks as well as when planning road drainage systems.
Sewer base maps may be combined with any other technical drawings and displayed in the base map view.
LandXML Import/Export
Import and export terrain models, alignments, vertical alignments and cross-sections in the LandXML format.
Profile Drawing / Profile Drawing (Rail)
You can create engineering-grade longitudinal profile drawings with vertical alignments, longitudinal ground profiles, flexible annotations, curvature strings, cant gradient strings, sight distance strings or other strings.
These drawing components can be displayed together with tangent strings, dimensionings, drawing sheet borders and title block fields in a card_1 drawing.
Profile Drawing (Sewer)
You can create complete, technically-sound profile drawings in compliance with the existing guidelines with flexible annotations, sewers and other strings.
Sewer profile drawings may also be generated in reference to any existing road longitudinal profile. These drawing portions are displayed in the same manner with tangent strings, dimensions, drawing sheet borders and titleblocks in one drawing.
Drinking Water Supply Design
Design, calculate and document drinking water supply networks right down to each node's details.
Drinking Water Supply Cadastre
Set up, manage, calculate, document, analyze and evaluate drinking water supply networks.
Drinking Water Supply Cadastre Viewer
View and evaluate projects in the Drinking Water Supply Cadastre module.
Land Survey Register Preparation
If you work with land acquisition, land usage or land consolidations, importing the necessary initial data is as simple as a mouse click. Working with land parcels, you need not only the geometry, but also the land registers, property owners, type of land usage and various other data from the real estate registers.
If the data is available electronically, you can not only import it easily, but you can also decide whether to import all or only a part of the data in order to keep your project data to a minimum.
The data is automatically compared with existing data while being imported. If, for example, a land register already exists for the project, it will not be imported again but will merely be updated should it contain additional information.
Overlapping deliveries can be safely imported without any problems. The data of the land acquisition database are linked to graphics data if available. ALK (real estate maps) and ALB (real estate registers) therefore form one cohesive data unit within card_1.
Volumes from Cross-Sections
You can calculate volumes and surfaces from cross-sections according to the guidelines REB-VB 21.003 and REB-VB 21.013. Any data and parameters used to control a volume calculation are saved, thus enabling the calculation to be entirely checked and analysed at any time.
Network Adjustment
Network measurements are amazingly easy to evaluate using card_1. Intelligent network sketches display the quality of your observations and indicate where corrections should be applied. The card_1 Network Adjustment has been officially certified by the DB Netz AG (Track Infrastructure Corporate Division of the German Federal Railways).
Levelling
You can use this module to import, edit, manage and evaluate surveying information logged with automatic levelling instruments from manufacturers such as, Leica, Topcon and Zeiss.
Engineering levelling and precise levelling are both calculated. The results are saved as point heights. Cross-sections are also generated when evaluating cross-section surveys. Height differences, once calculated, can be used as observations in network adjustments.
OKSTRA Export Design
Export card_1 data (schematics: 008 – design, 018 – geometry, 021 – general. Geometry objects incl. point clouds, 022 – land acquisition (requires Land Acquisiton Logging module), 024 – Cadastre, 030 – topography) in the OKSTRA format.
OKSTRA Import Design
Import data (schematics: 008 – design, 018 – geometry, 021 – general. Geometry objects incl. point clouds, 030 – topography) in the OKSTRA format.
Cross-Sections from Lines
You can calculate alignment related cross-sections and longitudinal profiles from lines of the card_1 base map. This method is very convenient if the base map data provides sufficient information or the creation of a digital terrain model is not required or not possible; e.g. digitized contour lines. more >
Cross-Sections from Points
This module enables you to calculate cross section lines and longitudinal profile lines according to the guidelines REB-VB 20.003 from existing cross-sections and longitudinal profiles which have been surveyed as topographic points. more >
Cross-Section Editing
Define additional, non-standardized cross-sections and special cross-sections to calculate drainage systems.
Point Cloud Evaluation
Generate longitudinal profiles, cross-sections and terrain points from point clouds. Additional commands in the cross-section designer to access point cloud data in cross-sections.
Point Cloud Management
Point cloud import (e.g. laser scanner data). Coloured display in the base map, in longitudinal profiles and cross-sections. Create and output drawings to any common plotters or printers.
Cross-fall Generator

You can use this module to automatically generate cross-fall strings which conform to the relevant design guidelines and which are optimized in terms of vehicle dynamics. The road surface type, the vehicle dynamics parameters as well as the spatial route geometry are taken into account. The program supports any designs that conform to the relevant guidelines, roads with empirical parameters and inner-city streets with constrainments according to the German guidelines of the FGSV. The speeds are also taken into account. An interactive v85 speed generator is integrated in the program.
When dealing with routes which do not comply with the relevant design guidelines (especially existing routes), twist-related corrections may be defined to ensure controllable steering; the parameters required are simulated thus substantially increasing safety and driving comfort.
Cross-Section Editor
This module enables you to perform your cross-sectional design and calculation tasks. All editing is done in the graphics, starting with the design of cross-sections right through to the determination of volumes. Any existing width strings, cross-fall strings and vertical alignments can be used as planning aids.
If required, you can obtain a 3D effect by taking the neighbouring chainages into account when deciding on design issues.
You can also interactively calculate the cross-section volumes and you can output these volumes together with the individual values. more >
Cross-Section Design / Cross-Section Design (Rail)
You can design and edit cross-sections and surface structure lists in a highly automatic manner with this module. This module is a very versatile tool to work on projects with many special conditions and different guidelines while keeping the planning time and costs to a minimum.
The cross-section designer offers unlimited freedom during the design process, making it possible to turn your ideas into reality. more >
Cross-Section Transformation
This module enables you to transform and move cross-sections. The cross-section lines are transformed so that they retain their original approximate plan position.
Moving cross-section lines is useful if the chainages of the alignment originally used have had to be modified during the design process. The use of this function eliminates the need to create new cross-sections at the modified chainages. This is especially useful if the cross-sections cannot be generated again, either because they were created manually or have been extensively revised. more >
Cross-Section Drawing / Cross-Section Drawing (Rail)

You can create cross-section drawings with individual sheet positioning, flexible annotation and design.
You can display and output surveying vehicles, road and rail furniture objects, trees and hedges. more >
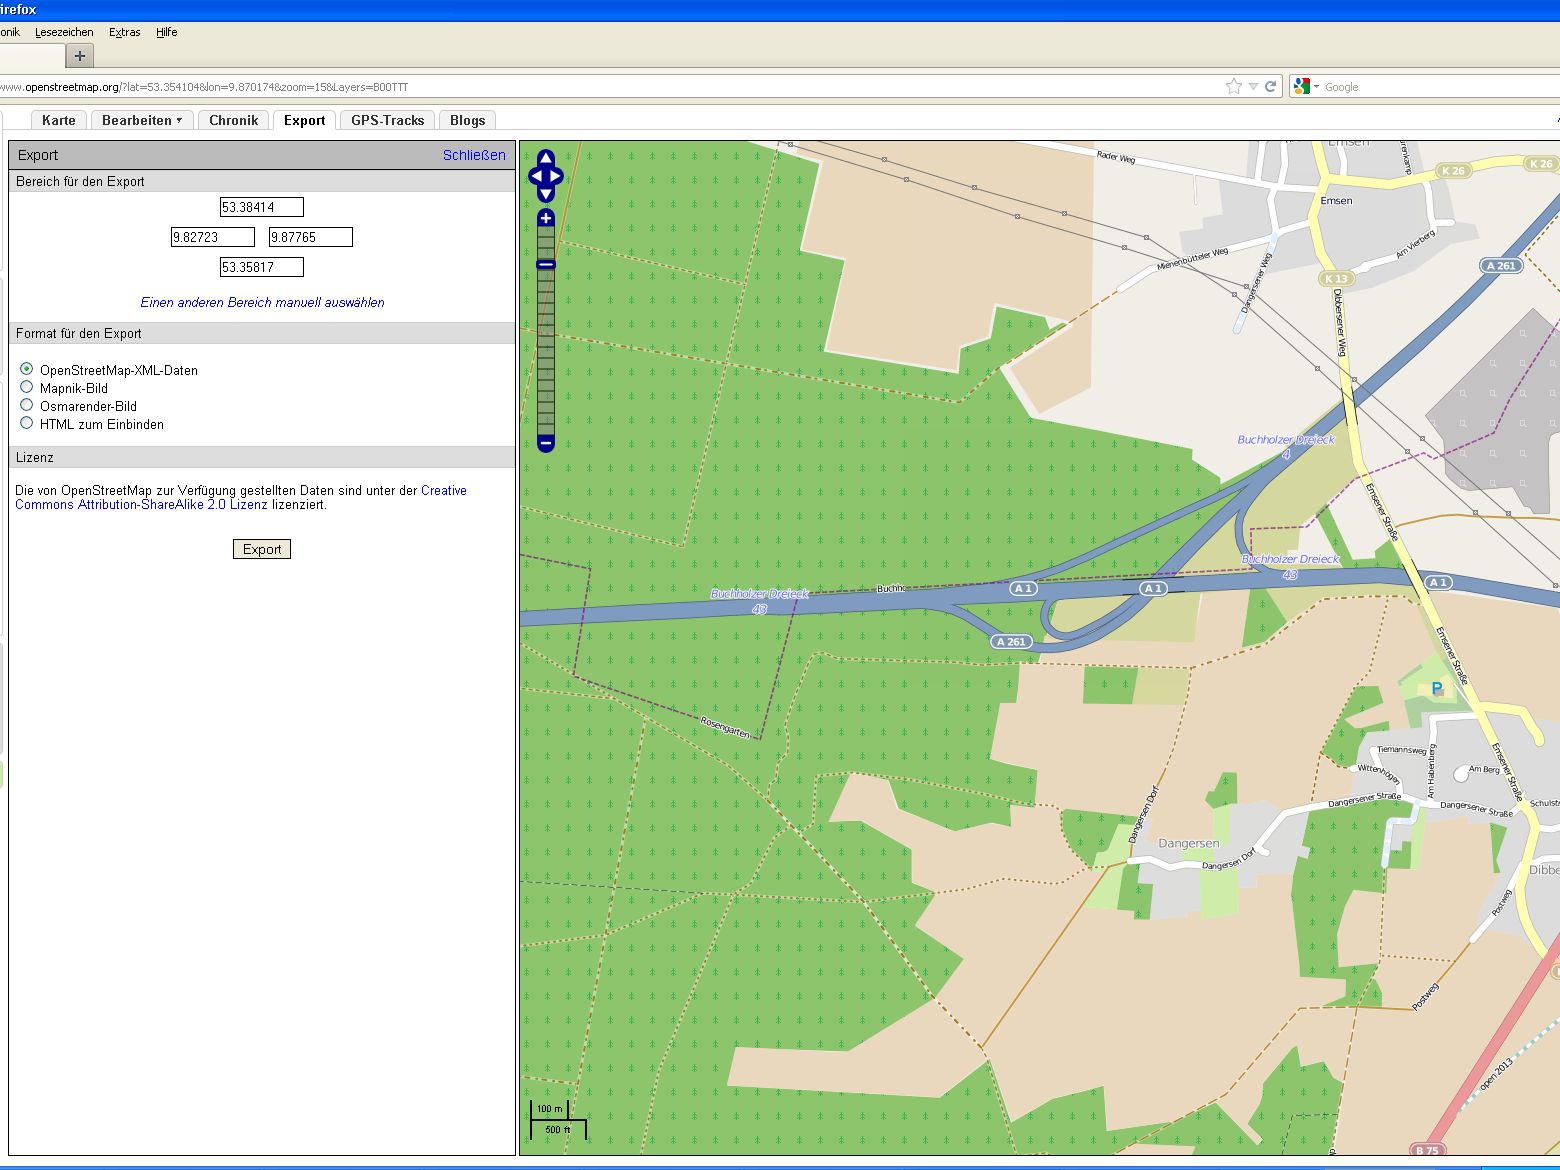
Raster Image Editing
In many cases there is no need to laboriously digitize existing plans and aerial photos but just use them as-is as a planning basis. This module offers powerful editing and export features for such data.
By integrating maps, satellite photos and other images into your project data you can significantly increase the level of project information; thus presenting your planning tasks more precisely and clearly.
Raster Image Display
You can combine your project data with convincing raster data in order to clearly present your designs to your clients, with for example: scanned-in drawings, maps, aerial photos, satellite photos or other types of raster data.
Raster images can be displayed in all base-map-related modules, such as Base Map or in Alignment Design.
Raster Image Digitizing
You can digitize points and lines on-screen, based on scanned-in maps. This module is an indispensable add-on when manually compiling data at the digitizing board - especially when dealing with large amounts of data.
Thanks to the numerous convenient on-screen editing functions and the excellent display features you can achieve an evenly high quality of the digitized data.
Regulations Catalogue
Creation, output and management of regulation catalogues (RV) according to the German guidelines RE 2012, including automatic number updates in forms and drawings as well as drawing generation and adaptation.
Swept Turning Path
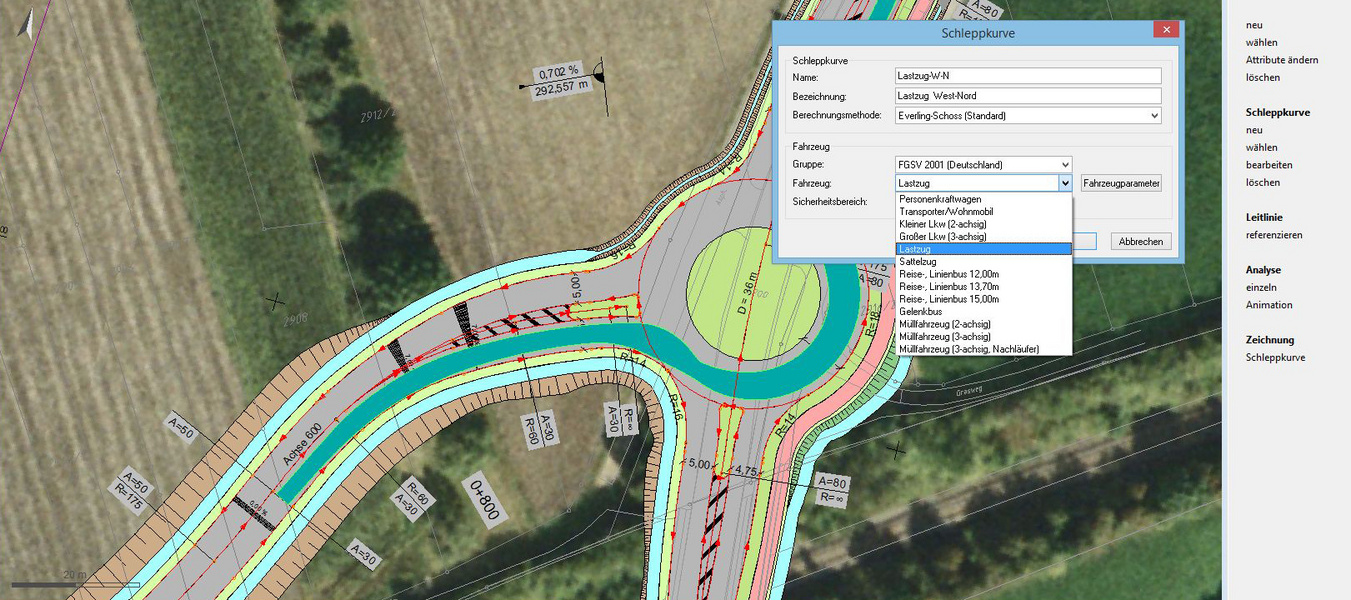
Calculate swept turning paths based on the vehicle track method, incl. vehicle library. Display in the base map, simulation of the manoeuvres, various evaluation functions.
Sight Distances

With one mouse click, you can determine the required as well as the actual stopping and overtaking sight distances; for both directions of travel and according to the relevant guidelines. You can calculate the actual sight distances by choosing either a vertical alignment-related 2D method or a complex 3D method which takes the three dimensional geometry of the road into account.
The information on the determined sight distances is displayed in a very clear manner in the graphics and can be integrated into longitudinal profile drawings, cross-section drawings and into base maps. The required sight distances can easily be determined using the card_1 route simulation.
This module supports the BIM planning process more >
card_1 makes it easy to check that your designs are in line with the Visualisation Guidelines HViSt for standard spatial elements, concealed starts of curves and critical areas of obstructed vision.
Special Structures Sewer
Special structures adds to what the Sewer Design module can do in terms of designing, editing, managing and calculating the special sewer structures of local drainage systems.
STANET Import/Export
Two-way interface to the STANET pipeline network calculation program of Ingenieurbüro Fischer-Uhrig.
Street Furniture Catalogue
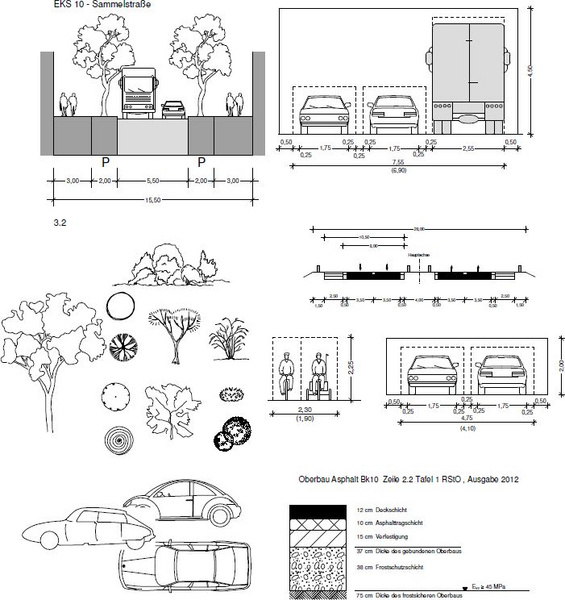
The street furniture catalogue (StraKat) contains a wide range of drawing objects to design base maps and longitudinal profiles, standard cross-sections and road cross-sections as well as other drawings.
System
All card_1 modules are based on the basic module System. The modern MDI technology, a clearly structured data presentation and the technically sound design of the user interface are features of the basic module.
An easy-to-use project manager and file manager, a text editor, table editing, catalogues, technical presettings, project samples, system services and a comprehensive online documentation are fully integrated in the system. The basic module is free of charge.
Tacheometer Transfer
Data transfer between electronic fieldbooks (Zeiss, Leica, Topcon, Geodimeter, Trimble, etc.) and card_1, preparation of data for processing using Surveying module.
Transformations
Transform coordinates for project data. Supports various transformations such as Federal state solutions for GK/ETRS89, NTv2-transformations, control point-based methods and setting transformation parameters etc. Optional transformation "on the fly" when importing and exporting project data such as ALKIS-imports.
Transformations (DB_REF)
Additional features to directly support the GNTRANS transformation solution in order to transform project data between the Gauß-Krüger system or ETRS89 and the DB_REF system.
Maglev
You can use this module to design maglev routes. This module is based on the current card_1 version and offers additional features which are required to design maglev routes.
This module meets all guidelines to design maglev routes as well as the project work guidelines. The maglev route is designed in such a manner that the acceleration and jolt values are not exceeded.
Route Plan

You can use this module to create complete route and track marking plans for single and double-track lines in accordance with the relevant guidelines of the German Federal Railways.
As a special case, it is also possible to generate route plans for double-track lines, from which one of the tracks has been removed. In this case, the remaining track may wander between the left and right side of the sub-grade several times per kilometer.
Traffic Sign Catalogue
The card_1 traffic sign catalogue (VzKat) contains the official traffic signs according to StVO (German traffic regulations). Each individual traffic sign is managed as a card_1 drawing object in this library and can therefore be accessed directly.
Surveying / Surveying (Rail)
You can solve your surveying-related standard tasks using the module Surveying. Besides the interactive graphic evaluation of tacheometric measurements, the module provides all of the important coordinate transformations, the calculation of setting-out values and many more features.
VESTRA Import Route Data
Import route data in the VESTRA format (S40) as card_1 alignments incl. description.
Virtual Reality
Displaying 3D project data in virtual space. Move freely within the 3D project. Simulate routes and assess sight distances in virtual space. Detect conflicts/glitches more easily. Real simulaton. Clear presentations and visualisation.
Switch Elevation Plan
You can use this module to draw complete switch elevation plans including plan and elevational views of track alignments, chainage strings as well as drawing borders with title blocks and legends.
Sewer Network Valuation
Determine the value of a selected area of an existing sewer network. Current replacement values, construction costs and depreciation data can be calculated for manholes and reaches with the help of a volume estimation method based on the principles of the DWA-A133.
Drawing Editing
You can create, edit and compile scale-related or project-related drawings with this module. The drawings can be output to any common plotters or printers.
Clear drawing structures, convenient editing functions and a sound management system aid you when creating drawings. The structure and architecture of the drawings as well as the various features to re-use drawing components helps you to avoid doubling up on work and to quickly create follow-up drawings.
The multi-user feature is ideal for planning teams. Within one project a project group can work on the different components of a drawing simultaneously.
Drawing Editing is required to manage and output drawings which you previously generated with the drawing generators in the areas base map, alignment, vertical alignment, cross-section, rail and sewer.